Analytics & Task Management Application
A team analytics dashboard with task management, reporting, and role-based access for tracking productivity metrics.
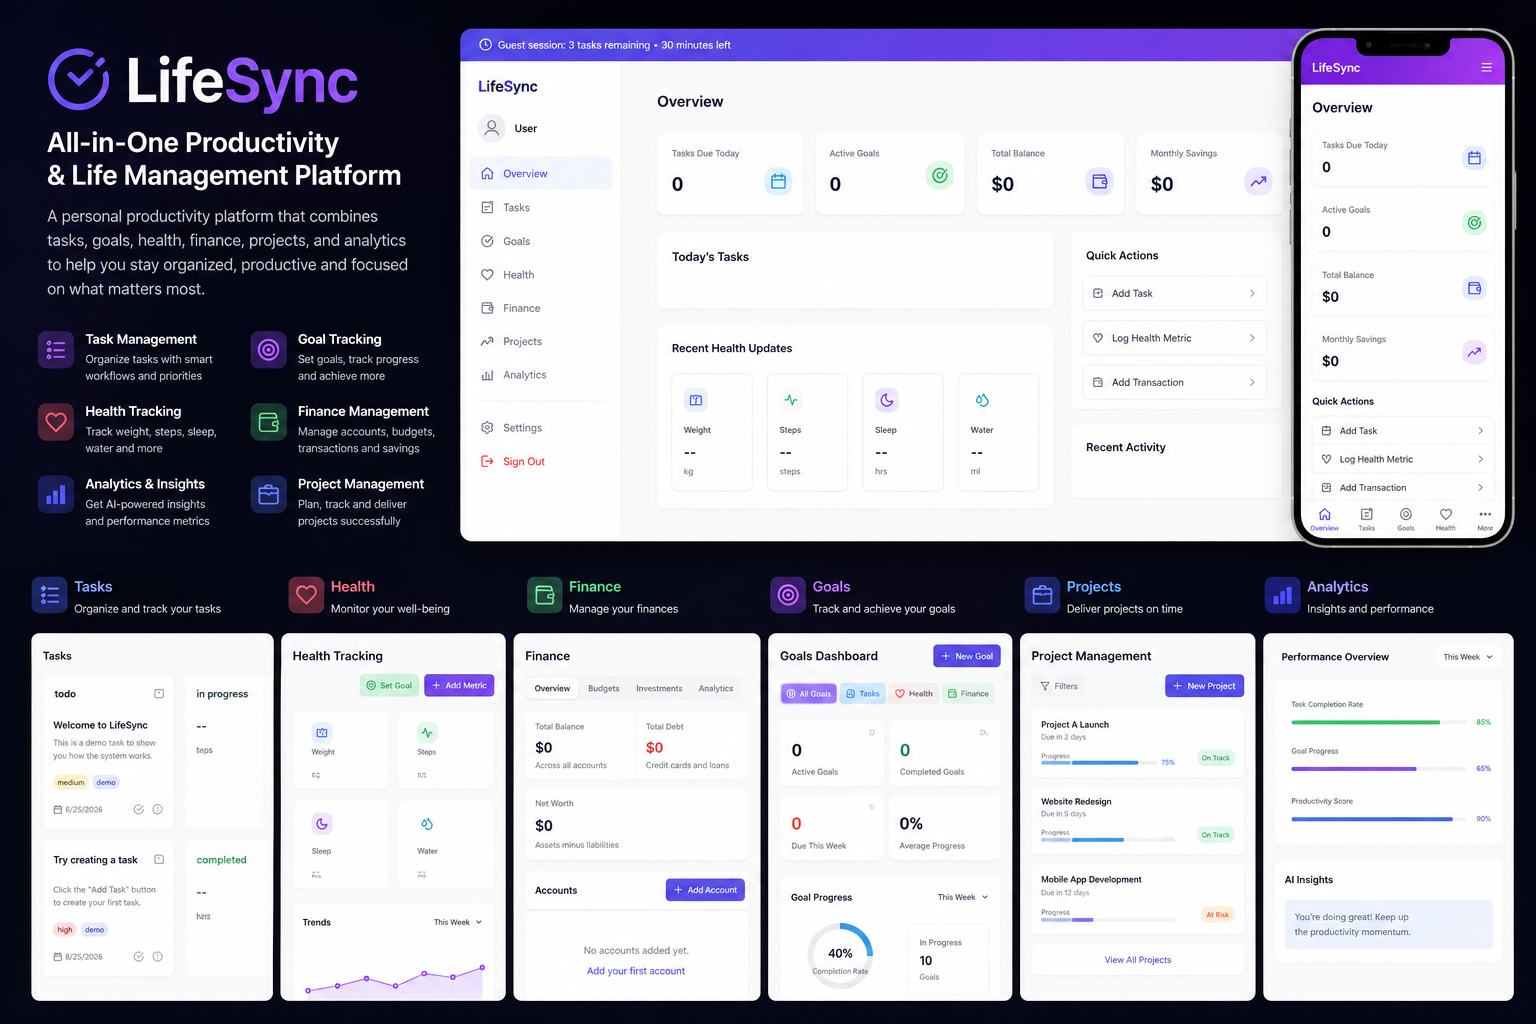
What was built
A combined analytics and task-management application that gives teams real-time productivity dashboards alongside structured task workflows.
What it solved
Teams were tracking tasks and metrics in separate tools with no unified view, making it hard to connect day-to-day work to productivity trends.
What I built
Built the React dashboard and charting layer, designed the Node.js/Express API, and implemented the PostgreSQL data model for tasks and metrics.
How it was built
Frontend
React dashboard with role-based views, chart visualizations, and task board interactions.
Backend
Node.js + Express REST API for tasks, users, and aggregated metrics.
Database
PostgreSQL schema for tasks, time entries, and rollup metrics.
Authentication
JWT-based auth with role-based access control.
What was hard
Aggregated metrics at scale
Built rollup queries and caching to keep dashboard load times fast as task volume grew.
Role-based access
Implemented fine-grained permissions so users only saw the projects and metrics they had access to.
Why these choices
Server-side rollups over client aggregation
Computed metric aggregations in PostgreSQL and cached hot ranges to avoid pushing heavy aggregation to the browser.